Goal
SOA Suite uses various database calls to process the requests.
If any issue reported is due to database performance this note will help to
diagnose the issue further.
If the issue reported is due to a database call, the root cause
could be one of the following.
1. Database
is processing the queries slowly.
a. AWR
to analyze the query performance
b. Database
Mode - Shared Vs Dedicated
2. Not
enough resources on WLS data sources to process the requests.
a. Connection
pool waiting
Database is processing
the queries slowly
To identify whether the database is processing the queries slowly, collect
AWR report at the time of the issue. AWR report will provide query statistics
on how much time it took to process the query on various views.
AWR
to analyze the query performance
Automatic Workload Repository (AWR) is the report generated by database to
collect the performance statistics of the database. By default, oracle database
generates snapshots for every hour and keeps the statistics for 7 days.
a. Collecting
AWR Report
b. Analyze
AWR Report
Collecting AWR Report:
AWR can be collected in multiple ways(through EM Console / through SQL Plus).
In this note, we collected AWR report through the script awrrpt.sql. AWR
report should be collected for the time period issue occurred.
Steps to create AWR
Report:
1. Login into SQLPlus
as sysdba
2. Run $ORACLE_HOME/rdbms/admin/awrrpt.sql
3. Select the type of the report
4. Enter the number of days the report needs to be pulled out.
5. Enter the snapshot id for the beginning and the end. Snapshot id will be
listed after performing step 4.
6. Enter the report name / leave default.
Sample AWR Report
Collection
SQL> connect / as sysdba
Connected.
SQL> @$ORACLE_HOME/rdbms/admin/awrrpt.sql
Current Instance
~~~~~~~~~~~~~~~~
DB Id DB Name Inst Num Instance
----------- ------------ -------- ------------
704392079 MUTHU 1 muthu
Specify the Report Type
~~~~~~~~~~~~~~~~~~~~~~~
Would you like an HTML report, or a plain text report?
Enter 'html' for an HTML report, or 'text' for plain text
Defaults to 'html'
Enter value for report_type: html
Type Specified: html
Instances in this Workload Repository schema
~~~~~~~~~~~~~~~~~~~~~~~~~~~~~~~~~~~~~~~~~~~~
DB Id Inst Num DB Name Instance Host
------------ -------- ------------ ------------ ------------
* 704392079 1 MUTHU muthu mutsubra-pc
Using 704392079 for database Id
Using 1 for instance number
Specify the number of days of snapshots to choose from
~~~~~~~~~~~~~~~~~~~~~~~~~~~~~~~~~~~~~~~~~~~~~~~~~~~~~~
Entering the number of days (n) will result in the most recent
(n) days of snapshots being listed. Pressing <return> without
specifying a number lists all completed snapshots.
Enter value for num_days: 1
Listing the last day's Completed Snapshots
Snap
Instance DB Name Snap Id Snap Started Level
------------ ------------ --------- ------------------ -----
muthu MUTHU 12927 25 Oct 2011 00:00 1
12928 25 Oct 2011 01:00 1
12929 25 Oct 2011 02:00 1
12930 25 Oct 2011 03:00 1
12931 25 Oct 2011 04:00 1
12932 25 Oct 2011 05:00 1
12933 25 Oct 2011 06:00 1
12934 25 Oct 2011 07:00 1
12935 25 Oct 2011 08:00 1
12936 25 Oct 2011 09:00 1
12937 25 Oct 2011 10:00 1
12938 25 Oct 2011 11:00 1
12939 25 Oct 2011 12:00 1
12940 25 Oct 2011 13:00 1
Specify the Begin and End Snapshot Ids
~~~~~~~~~~~~~~~~~~~~~~~~~~~~~~~~~~~~~~
Enter value for begin_snap: 12939
Begin Snapshot Id specified: 12939
Enter value for end_snap: 12940
Specify the Report Name
~~~~~~~~~~~~~~~~~~~~~~~
The default report file name is awrrpt_1_12939_12940.html. To use this name,
press <return> to continue, otherwise enter an alternative.
Enter value for report_name:
Hit enter to get the awr report.
Report 2:
SQL> @$ORACLE_HOME/rdbms/admin/awrrpti.sql
Specify the Report Type
~~~~~~~~~~~~~~~~~~~~~~~
Would you like an HTML report, or a plain text report?
Enter 'html' for an HTML report, or 'text' for plain text
Defaults to 'html'
Enter value for report_type: html
Type Specified: html
Instances in this Workload Repository schema
~~~~~~~~~~~~~~~~~~~~~~~~~~~~~~~~~~~~~~~~~~~~
DB Id Inst Num DB Name Instance Host
------------ -------- ------------ ------------ ------------
* 704392079 1 MUTHU muthu mutsubra-pc
Enter value for dbid: 704392079
Using 704392079 for database Id
Enter value for inst_num: 1
Using 1 for instance number
Specify the number of days of snapshots to choose from
~~~~~~~~~~~~~~~~~~~~~~~~~~~~~~~~~~~~~~~~~~~~~~~~~~~~~~
Entering the number of days (n) will result in the most recent
(n) days of snapshots being listed. Pressing <return> without
specifying a number lists all completed snapshots.
Enter value for num_days: 1
Listing the last day's Completed Snapshots
Snap
Instance DB Name Snap Id Snap Started Level
------------ ------------ --------- ------------------ -----
muthu MUTHU 12927 25 Oct 2011 00:00 1
12928 25 Oct 2011 01:00 1
12929 25 Oct 2011 02:00 1
12930 25 Oct 2011 03:00 1
12931 25 Oct 2011 04:00 1
12932 25 Oct 2011 05:00 1
12933 25 Oct 2011 06:00 1
12934 25 Oct 2011 07:00 1
12935 25 Oct 2011 08:00 1
12936 25 Oct 2011 09:00 1
12937 25 Oct 2011 10:00 1
12938 25 Oct 2011 11:00 1
12939 25 Oct 2011 12:00 1
12940 25 Oct 2011 13:00 1
Specify the Begin and End Snapshot Ids
~~~~~~~~~~~~~~~~~~~~~~~~~~~~~~~~~~~~~~
Enter value for begin_snap: 12939
Begin Snapshot Id specified: 12939
Enter value for end_snap: 12940
End Snapshot Id specified: 12940
Specify the Report Name
~~~~~~~~~~~~~~~~~~~~~~~
The default report file name is awrrpt_1_12939_12940.html. To use this name,
press <return> to continue, otherwise enter an alternative.
Enter value for report_name:
The two reports give essential the same output but the awrrpti.sql allows you
to select a single instance
Analyze
AWR Report
AWR Report has various sections for DBA to analyze DB performance. This note is
intended to analyze the database calls related to SOA suite/SQL's generated
from SOA. Check whether any of the query related to SOA Suite / the operation
took long time on the database in the below AWR Sections. Any query listed on
top of the list should be verified to see whether it's normal and if it's
not check whether any known issues reported or file a bug to address the
issue.
SQL
ordered by Elapsed Time
SQL
ordered by CPU Time
SQL
ordered by Gets
SQL
ordered by Reads
SQL
ordered by Executions
SQL
ordered by Parse Calls
SQL
ordered by Elapsed Time
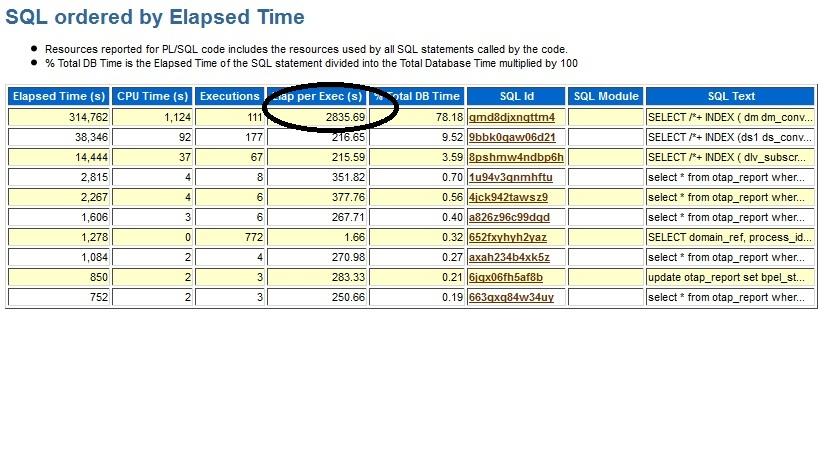
This section lists the SQL's with larger elapsed time. Elapsed time includes
CPU time plus any other wait times. Check the elapsed time of individual
occurrence is larger and if yes, the SQL execution is having problem. This
table lists the SQL in descending order of Total Elapsed time. In the above
screenshot the top query elapsed time per execution is 2835.69 seconds which is
very high. Check the SQL Query associated with this call. To get the query
select the SQL ID (gmd8djxngttm4)

Check whether any known issues reported on the above query execution time and
if not we need to check with engineering why this query is taking long time to
process. If the query execution itself is taking long time, the JDBC
calls made from SOA will wait till it gets the response back which could cause
stuck threads, timeout issues etc.
SQL
ordered by CPU Time

Usually the SQL's in the top list in Elapsed time gets into the CPU time as
well. But it's not mandatory. If the SQL exists in Elapsed time table but not
in CPU time table, then there is an issue with recursion associated with this
statement. Larger CPU time usually caused by excessive function calls, missing
filter columns in the query results full table scan.
If the query which is in top of the list is from SOA, check the complete query
by selecting the "SQL Id" (Queries will be listed at the bottom of
the AWR report). Check the table in the database and see whether the filter
column(s) in the query is sufficient to identify the unique records or it's
doing full table scan/ filter is inefficient. Also check whether indexes are
created for the fields in the where class of SQL Query. If not indexes are
missing which could result in excessive CPU time.
In the above screenshot, SQL Id (gmd8djxngttm4) is the same SQL which is top in
Execution time as well. This query is not having any excessive function calls,
possible reason for this call could be full table scan due to missing filter
columns.
SQL
Ordered by Gets

SQL's listed in this section results large logical reads from DB Block buffers.
Usually reading from logical read is desirable but excessive reading from
logical also can cause performance issues. High logical read results due to
missing indexes on the filter columns or full table scan. Setting proper filter
columns or indexes could help result reducing the logical read time.
In the above list, out of 175M buffer gets, 152k buffer gets are from single
query which doesn't look good and definitely result of large table scan / full
table scan. Query shows the same which was involved in CPU, Elapsed times so
the query with SQL Id (gmd8djxngttm4) is having some problem.
SQL
Ordered by Reads

SQL's in this section list the query resulted in larger disk reads (physical
read) rather than reading from buffers. Usually disk reads are undesirable.
Excessive disk reads cause performance issues. Usually larger disk reads is due
to missing indexes results in full table scan results which results larger
reads. In order to address this either user can increase the buffer cache (from
DB side if the memory is not a constraint) or they need to tune the query /
table to avoid full table scans.
In the above provided screenshot, the SQL Id (gmd8djxngttm4) is the one in the
top of the list is doing larger physical reads is the same query which was
identified in CPU Time, Elapsed time, Gets etc. Since this query is getting in all
table top list this query most probably having problem.
SQL
Ordered by Executions:

SQL Queries listed in this table are the queries executed most(Number of
executions) in the time period this AWR was taken. Sometimes queries in this
list could be fine if the code is executing the query multiple times / the same
functionality is executed multiple times results this high number. Check
queries in this table is also part of the other tables then it could be a
problem and need to take care of.
You can identify in weblogic debug which queries are getting executed for every
SOA operation. For eg. Creating a BPEL instance will insert a record into
cube_instance table with the below query.
INSERT INTO CUBE_INSTANCE (CIKEY, PARENT_REF_ID, AG_ROOT_ID,
TEST_RUN_ID, COMPOSITE_LABEL, STATE, CONVERSATION_ID, EXT_STRING1, MODIFY_DATE,
SCOPE_USIZE, STAGE, AT_COUNT_ID, CREATOR, ECID, PARENT_ID, TITLE, PRIORITY, TEST_SUITE,
TEST_CASE, METADATA, SCOPE_CSIZE, COMPOSITE_NAME, STATUS, ROOT_ID, DOMAIN_NAME,
CREATE_CLUSTER_NODE_ID, OUTCOME, CMPST_ID, EXT_INT1, AG_MILESTONE_PATH,
COMPONENTTYPE, PROCESS_TYPE, MODIFIER, CREATION_DATE, AT_DETAIL_ID,
COMPONENT_NAME, SCOPE_REVISION, EXT_STRING2, AT_EVENT_ID, COMPOSITE_REVISION,
TEST_RUN_NAME, CACHE_...
If anyone is creating multiple instances, then the above query will get
executed multiple times and it could be part of the top of the list. If that is
the case it could be normal.
You can enable JDBC SQL debug on WLS level to identify what queries are
triggered for SOA operation. Please refer JDBC
Debug to Identify the SQL Query section for more details.
In the above snapshot, queries in the top of this table list is not listed in
any other tables (CPU Time, Elapsed time, Gets or Read), so probably the
queries in this table should be fine in this AWR report.
SQL
Ordered by Parse Calls:

SQL's listed in this table list the SQL's which are all parsed/re-parsed.
Whenever a SQL contains unsafe bind variables, then the statement will get
parsed each time. If a SQL statement is parsed many times, it can lead to
larger execution time.
Check whether any of the SOA SQL's are involved in the larger parse and if yes,
check whether this SQL is part of larger Elapsed Time table as well. If yes we
need to check why the query is parsed multiple times and whether it's normal.
In the above snapshot, we didn't see any of the SOA SQL's in the top list took
higher elapsed time so this table should be fine.
Database
Modes - Shared Vs Dedicated
Type of connection to the database can also cause performance issues.
Connection to the database can be done in shared mode or dedicated mode. If the
database is configured with shared mode, this configuration also can cause
performance issues/delay in query processing. In that case, AWR report won't
show any of the queries took long time to process. But in thread dumps, threads
will be waiting for the database calls to finish.
Sample thread waiting for DB Call to finish:
"[ACTIVE] ExecuteThread: '3' for queue:
'weblogic.kernel.Default (self-tuning)'" id=68 idx=0x130 tid=3996 prio=5
alive, in native, daemon
at jrockit/net/SocketNativeIO.readBytesPinned(Ljava/io/FileDescriptor;[BIII)I(Native
Method)
at jrockit/net/SocketNativeIO.socketRead(SocketNativeIO.java:32)
at
java/net/SocketInputStream.socketRead0(Ljava/io/FileDescriptor;[BIII)I(SocketInputStream.java)
at java/net/SocketInputStream.read(SocketInputStream.java:129)
at oracle/net/ns/Packet.receive(Packet.java:293)
at oracle/net/ns/DataPacket.receive(DataPacket.java:104)
at oracle/net/ns/NetInputStream.getNextPacket(NetInputStream.java:315)
at oracle/net/ns/NetInputStream.read(NetInputStream.java:260)
at oracle/net/ns/NetInputStream.read(NetInputStream.java:185)
at oracle/net/ns/NetInputStream.read(NetInputStream.java:102)
at
oracle/jdbc/driver/T4CSocketInputStreamWrapper.readNextPacket(T4CSocketInputStreamWrapper.java:124)[inlined]
at
oracle/jdbc/driver/T4CSocketInputStreamWrapper.read(T4CSocketInputStreamWrapper.java:80)[optimized]
at
oracle/jdbc/driver/T4CMAREngine.unmarshalUB1(T4CMAREngine.java:1136)[inlined]
The issue could be due to the database is receiving multiple queries and
queries are queued for processing. Queries are executed in the database faster
but every client is using the shared connection, queries gets executed only on
database when it gets resources. AWR report shows the actual query execution
time which is faster because the delay is due to the time wait on the query to
be executed due to shared connection.
In such scenario, setting the database property to dedicated mode should help
improving the performance. Dedicated mode setting can be done on server as well
as client side. Check with DBA to set the dedicated mode setting on server
side. For the client side add the property ServerType=dedicated for the
connection pool will set the connections created by the pool to be dedicated.
Any changes to datasources properties requires server restart. After restarting
the servers, dedicated connection property should help address the performance
issue if the performance issue is due to shared connection. It's not always a
solution to use dedicated connection. Please check with DBA whether dedicated
connection is acceptable before making this change as this reserve the
resources for every client which could affect the total DB performance.
If AWR report shows the query execution is faster and if WLS
threads are waiting for database calls to finish, it's worth to try dedicated
mode and see whether the issue is due to the shared mode setting in DB.
More details about dedicated and shared mode can be found at
http://download.oracle.com/docs/cd/B28359_01/server.111/b28310/manproc001.htm
Not
enough resources on WLS data sources to process the requests
Database query performance impact can be due to the insufficient resources
on WLS side as well. This section will help to debug on WLS side to collect
more details about the database queries and analyze whether WLS has enough
resources to process the database requests and how to troubleshoot the same.
Connection
pool waiting
Sometimes SOA performance affects due to not enough connections available in
the weblogic connection pool. Below section helps how to analyze the issue.
Usually weblogic server throw the below exception(s) reporting increasing the
connection pool count. You may see the following exceptions in the server log
if weblogic server connection pool is not having enough connections to serve
the requests .
java.sql.SQLException: Internal error: Cannot obtain
XAConnection weblogic.common.resourcepool.ResourceLimitException: No resources
currently available in pool SOADataSource to allocate to applications, please
increase the size of the pool and retry..
at weblogic.common.resourcepool.ResourcePoolImpl.reserveResourceInternal(ResourcePoolImpl.java:577)
at
weblogic.common.resourcepool.ResourcePoolImpl.reserveResource(ResourcePoolImpl.java:342)
at
weblogic.common.resourcepool.ResourcePoolImpl.reserveResource(ResourcePoolImpl.java:329)
at weblogic.jdbc.common.internal.ConnectionPool.reserve(ConnectionPool.java:417)
at
weblogic.jdbc.common.internal.ConnectionPool.reserve(ConnectionPool.java:324)
at
weblogic.jdbc.common.internal.ConnectionPoolManager.reserve(ConnectionPoolManager.java:94)
at weblogic.jdbc.common.internal.ConnectionPoolManager.reserve(ConnectionPoolManager.java:63)
at weblogic.jdbc.jta.DataSource.getXAConnectionFromPool(DataSource.java:1677)
at weblogic.jdbc.jta.DataSource.refreshXAConnAndEnlist(DataSource.java:1475)
at weblogic.jdbc.jta.DataSource.getConnection(DataSource.java:446)
......
The above exception is a symptom that there is not enough connections available
to service the requests.
We can check how many threads are waiting for connections by colleting the
thread dump. Performance will get impacted if more threads are waiting for
connections with the below trace.
"orabpel.invoke.pool-4.thread-84" id=263 idx=0x6c
tid=12386 prio=5 alive, waiting, native_blocked
-- Waiting for notification on:
weblogic/jdbc/common/internal/GenericConnectionPool@0xbe8e1478[fat lock]
at jrockit/vm/Threads.waitForNotifySignal(JLjava/lang/Object;)Z(Native Method)
at java/lang/Object.wait(J)V(Native Method)
at
weblogic/common/resourcepool/ResourcePoolImpl.reserveResourceInternal(ResourcePoolImpl.java:531)
^-- Lock released while waiting:
weblogic/jdbc/common/internal/GenericConnectionPool@0xbe8e1478[fat lock]
at
weblogic/common/resourcepool/ResourcePoolImpl.reserveResource(ResourcePoolImpl.java:342)
at
weblogic/jdbc/common/internal/ConnectionPool.reserve(ConnectionPool.java:419)
at weblogic/jdbc/common/internal/ConnectionPool.reserve(ConnectionPool.java:324)
at
weblogic/jdbc/common/internal/ConnectionPoolManager.reserve(ConnectionPoolManager.java:94)
at
weblogic/jdbc/common/internal/ConnectionPoolManager.reserve(ConnectionPoolManager.java:63)
at weblogic/jdbc/jta/DataSource.getXAConnectionFromPool(DataSource.java:1677)
at weblogic/jdbc/jta/DataSource.refreshXAConnAndEnlist(DataSource.java:1445)
at weblogic/jdbc/jta/DataSource.getConnection(DataSource.java:446)
at weblogic/jdbc/jta/DataSource.connect(DataSource.java:403)
at
weblogic/jdbc/common/internal/RmiDataSource.getConnection(RmiDataSource.java:364)
To identify which datasource / connection pool requires more connection do the
following.
1. Go to WLS Admin console
2. Go to Environment -> Servers
3. Select the server on which the connection pool needs to be monitored
4. Go to Monitoring -> JDBC
5. Customize the table by adding the below 2 fields
a. Waiting for Connection Current Count
b. Waiting for Connection High Count
This page will list all the datasources/ connection pools targeted to that
particular server and how many connections are waiting to get the connection.
If more number of connections are waiting, that is not a good which will cause
performance impact and also cause stuck threads on the server if the wait time
is going to be beyond the thread stuck time (By default it's 10 mins).

Above screenshot shows SOADataSource state is "Overloaded" and also
the current wait is 111. There are 111 resources waiting for connection and
only one connection is available in the connection pool. The above setup is
definitely a problem which will result database calls performance issue.
In SOA, it's normal to increase the invoke threads count in EM Console to meet
the requirement (To process more requests). If the connection pool count is not
increased with respect to the invoker thread count, then it will cause this
kind of contention cause lot of calls to be waiting for connection.
Solution to the above problem is to increase the number of connections in the
connection pool.
Steps:
1. Go to WLS Console
2. Select Services -> Datasources -> Select the datasource you want to
change the pool size
3. Go to Configuration -> connection pool
4. Change the Maximum Capacity to the count which is required for your
environment.

JDBC
Debug to identify the queries
Sometimes it is required to identify the list of SQL's executed for a specific
operation. To check the list of SQL's got executed in weblogic server, it's
easy to enable debug in JDBC level which will capture all the SQL's triggered
through JDBC (Datasource - Connection Pool).
Enable Debug to see the
SQL's triggered:
Login into WLS Admin console.
Select the SOA Server (need to repeat this for all SOA Servers the debug needs
to be collected).
Go to Debug tab
Enable Weblogic -> JDBC -> sql -> DebugJDBCSQL.
Save and activate the changes.
Setting log level for
server:
Debug logs getting into server log only when the server logging level is set to
debug. Please make sure the server logging level is set to debug for the debug
logs to be logged.
Login into WLS Admin console
Select the server (need to repeat this for all servers the logging level to be
set)
Go to Logging tab -> Expand Advanced section
Set the Log file Severity level to "Debug".
Save the changes.
Restart the server for the changes to change effect.
If JDBC debug is enabled, SQL's triggered through the datasource will be
logged. Below sample was collected for the queries triggered for cube_instance
table through JDBCSQL debug.
<Oct 25, 2011
12:33:54 PM MDT> <Debug> <JDBCSQL> <mutsubra-pc>
<AdminServer> <orabpel.engine.pool-5.thread-1> <>
<BEA1-00B22D118D32C2CE5C8A>
<d126c29923b443ab:1a3db08d:1333c594d0b:-8000-0000000000000003>
<1319567634097> <BEA-000000> <[[weblogic.jdbc.wrapper.JTAConnection_weblogic_jdbc_wrapper_XAConnection_oracle_jdbc_driver_LogicalConnection-SOADataSource-35,
oracle.jdbc.driver.LogicalConnection@151b9890]] prepareStatement(SELECT
wi.CIKEY, wi.NODE_ID, wi.SCOPE_ID, wi.COUNT_ID, wi.LABEL, ci.DOMAIN_NAME,
ci.COMPONENT_NAME, ci.COMPOSITE_NAME, ci.COMPOSITE_LABEL,
ci.COMPOSITE_REVISION, ci.COMPONENTTYPE, ci.PRIORITY, wi.EXP_DATE FROM
WORK_ITEM wi, CUBE_INSTANCE ci WHERE wi.CIKEY = ci.CIKEY AND ci.STATE <= 3
AND wi.STATE = 1 AND wi.EXP_DATE is null AND wi.EXP_FLAG = 0 AND
wi.EXECUTION_TYPE!= 1 AND wi.MODIFY_DATE< ? AND ci.COMPONENTTYPE = ?)>
<Oct 25, 2011 12:36:38 PM MDT> <Debug> <JDBCSQL>
<mutsubra-pc> <AdminServer> <[ACTIVE] ExecuteThread: '2' for
queue: 'weblogic.kernel.Default (self-tuning)'> <weblogic>
<BEA1-04202D118D32C2CE5C8A>
<d126c29923b443ab:1a3db08d:1333c594d0b:-8000-000000000000039c>
<1319567798305> <BEA-000000>
<[[weblogic.jdbc.wrapper.JTAConnection_weblogic_jdbc_wrapper_XAConnection_oracle_jdbc_driver_LogicalConnection-SOADataSource-212,
oracle.jdbc.driver.LogicalConnection@151b9890]] prepareStatement(SELECT
count(*) FROM CUBE_INSTANCE ci WHERE ci.COMPONENTTYPE = ? AND ci.DOMAIN_NAME =
? AND ci.COMPOSITE_NAME = ? AND ci.COMPONENT_NAME = ? AND ci.COMPOSITE_REVISION
= ?)>
<Oct 25, 2011 12:36:38 PM MDT> <Debug> <JDBCSQL>
<mutsubra-pc> <AdminServer> <[ACTIVE] ExecuteThread: '2' for
queue: 'weblogic.kernel.Default (self-tuning)'> <weblogic>
<BEA1-04222D118D32C2CE5C8A> <d126c29923b443ab:1a3db08d:1333c594d0b:-8000-000000000000039c>
<1319567798317> <BEA-000000>
<[[weblogic.jdbc.wrapper.JTAConnection_weblogic_jdbc_wrapper_XAConnection_oracle_jdbc_driver_LogicalConnection-SOADataSource-213,
oracle.jdbc.driver.LogicalConnection@151b9890]] prepareStatement(SELECT
count(*) FROM CUBE_INSTANCE ci WHERE ci.COMPONENTTYPE = ? AND ci.DOMAIN_NAME =
? AND ci.COMPOSITE_NAME = ? AND ci.COMPONENT_NAME = ? AND ci.COMPOSITE_REVISION
= ? AND ci.STATE IN (3) )>
<Oct 25, 2011 12:36:38 PM MDT> <Debug> <JDBCSQL>
<mutsubra-pc> <AdminServer> <[ACTIVE] ExecuteThread: '2' for
queue: 'weblogic.kernel.Default (self-tuning)'> <weblogic>
<BEA1-04242D118D32C2CE5C8A>
<d126c29923b443ab:1a3db08d:1333c594d0b:-8000-000000000000039c>
<1319567798325> <BEA-000000>
<[[weblogic.jdbc.wrapper.JTAConnection_weblogic_jdbc_wrapper_XAConnection_oracle_jdbc_driver_LogicalConnection-SOADataSource-214,
oracle.jdbc.driver.LogicalConnection@151b9890]] prepareStatement(SELECT
count(*) FROM CUBE_INSTANCE ci WHERE ci.COMPONENTTYPE = ? AND ci.DOMAIN_NAME =
? AND ci.COMPOSITE_NAME = ? AND ci.COMPONENT_NAME = ? AND ci.COMPOSITE_REVISION
= ? AND ci.STATE IN (6, 10) )>
<Oct 25, 2011 12:36:38 PM MDT> <Debug> <JDBCSQL>
<mutsubra-pc> <AdminServer> <[ACTIVE] ExecuteThread: '2' for
queue: 'weblogic.kernel.Default (self-tuning)'> <weblogic>
<BEA1-04262D118D32C2CE5C8A> <d126c29923b443ab:1a3db08d:1333c594d0b:-8000-000000000000039c>
<1319567798332> <BEA-000000>
<[[weblogic.jdbc.wrapper.JTAConnection_weblogic_jdbc_wrapper_XAConnection_oracle_jdbc_driver_LogicalConnection-SOADataSource-215,
oracle.jdbc.driver.LogicalConnection@151b9890]] prepareStatement(SELECT
count(*) FROM CUBE_INSTANCE ci WHERE ci.COMPONENTTYPE = ? AND ci.DOMAIN_NAME =
? AND ci.COMPOSITE_NAME = ? AND ci.COMPONENT_NAME = ? AND ci.COMPOSITE_REVISION
= ? AND ci.STATE IN (1) )>
<Oct 25, 2011 12:37:11 PM MDT> <Debug> <JDBCSQL>
<mutsubra-pc> <AdminServer> <orabpel.invoke.pool-4.thread-1>
<> <BEA1-04BD2D118D32C2CE5C8A>
<d126c29923b443ab:1a3db08d:1333c594d0b:-8000-0000000000000406>
<1319567831486> <BEA-000000> <[[weblogic.jdbc.wrapper.JTAConnection_weblogic_jdbc_wrapper_XAConnection_oracle_jdbc_driver_LogicalConnection-SOADataSource-256,
oracle.jdbc.driver.LogicalConnection@151b9890]] prepareStatement(INSERT INTO
CUBE_INSTANCE (CIKEY, PARENT_REF_ID, AG_ROOT_ID, TEST_RUN_ID, COMPOSITE_LABEL,
STATE, CONVERSATION_ID, EXT_STRING1, MODIFY_DATE, SCOPE_USIZE, STAGE,
AT_COUNT_ID, CREATOR, ECID, PARENT_ID, TITLE, PRIORITY, TEST_SUITE, TEST_CASE,
METADATA, SCOPE_CSIZE, COMPOSITE_NAME, STATUS, ROOT_ID, DOMAIN_NAME,
CREATE_CLUSTER_NODE_ID, OUTCOME, CMPST_ID, EXT_INT1, AG_MILESTONE_PATH,
COMPONENTTYPE, PROCESS_TYPE, MODIFIER, CREATION_DATE, AT_DETAIL_ID,
COMPONENT_NAME, SCOPE_REVISION, EXT_STRING2, AT_EVENT_ID, COMPOSITE_REVISION,
TEST_RUN_NAME, CACHE_...

