Search This Blog

Wednesday, November 7, 2012

SOA Suite Performance Tuning


SOA Suite Performance Tuning 

Performance Tuning Resources Summary
• High Availability Guide
http://docs.oracle.com/cd/E23943_01/core.1111/e10106/toc.htm
• Disaster Recovery Guide
http://docs.oracle.com/cd/E23943_01/doc.1111/e15250/toc.htm
• Enterprise Deployment Guide
http://docs.oracle.com/cd/E23943_01/core.1111/e12036/toc.htm
• Performance Tuning Guide
– http://docs.oracle.com/cd/E23943_01/core.1111/e10108/toc.htm
• Adminstration Guide
– http://docs.oracle.com/cd/E23943_01/core.1111/e10105/toc.htm3

Presentations
• Large Scale High Volume B2B Deployment Presentation OOW 2011
– http://www.oracle.com/technetwork/middleware/soasuite/learnmore/soab2boow11-520428.pdf

• Tuning Your SOA Infrastructure for Performance and Scalability OOW 2011
– http://www.oracle.com/technetwork/middleware/soasuite/learnmore/odtugsoaperformancetuningsession-427186.pdf

• Advanced Administration and Management of Oracle SOA Suite 11g OOW 2011
– http://www.oracle.com/technetwork/middleware/soasuite/learnmore/advadminmgmntsoa-520618.pdf

• SOA Suite Performance Tuning Presentation OOW 2010
– http://www.oracle.com/technetwork/middleware/soasuite/soaperformancetuning-176286.pdf

• Caching Strategies for Oracle Service Bus 11g
– http://www.oracle.com/technetwork/articles/soa/bus-coherence-caching-421276.html4  |   © 2011 Oracle

Blogs
• Various blogs
– A-team
• https://blogs.oracle.com/ateamsoab2b/entry/welcome_to_the_a_team
– Others (many others besides this – google “Oracle SOA Suite Performance tuning”
      http://blog.ipnweb.com/2011/04/performance-tuning-oracle-soa-suite-11g.html
      http://niallcblogs.blogspot.co.uk/2011/04/soa-suite-11g-performance-tuning-part1.html
      http://soa-howto.blogspot.co.uk/2011/07/soa-11g-best-practices.html
      http://blog.guident.com/2011/10/free-tune-up-for-oracle-soa-11g/5  |   © 2011 Oracle Corporation –

White Papers
• Oracle SOA Suite 11 Purging Strategies
– http://www.oracle.com/technetwork/database/features/availability/soa11gstrategy-1508335.pdf
• Oracle SOA Suite 11g WP on DB-RAC Configuration
– http://www.oracle.com/technetwork/database/focus-areas/availability/maa-fmw-soa-racanalysis-427647.pdf
• Many other resources available on
– http://bit.ly/advancedsoasuite
– http://bit.ly/soaotn
– http://www.oracle.com
– https://blogs.oracle.com/SOA/

Sunday, November 4, 2012

JVM Heap Tuning on sun jdk using CMS Collector


Doesn't like to spend much time here.. just copied some useful information found in the net which helped me to tune the Sun JDK.

Some tips based on my analysis:

1) Study your CPU Architecture and hardware configuration.

2) Try to obtain benchmarking results for your CPU and hardware if available to know the optimal parameters.

http://www.spec.org/jAppServer2004/results/jAppServer2004.html

3) Understand your application requirements and also understand the JVM overheads in Younger and Older generations.

4) Give importance to throughput of the application . This may have deviations depends on the type of apps running on our JVM which again depends on reqs.

5) GC time length of minor and major collection should be better.  These pauses will affect the throughput and higher the pause time the Transactions Per Sec will be impacted. So minimize the STOP the world pauses both on younger and older generation.

6) Avoid Major collections on older generations and this can only be acheived by using CMS collector. Know your memory capacity and accordingly utilize it to maximize the benefits.

7) If you use CMS collector ensure that you control the CMS cyle on older generation as the CMS would trigger when size reaches to 92% by default and this would impact GC if larger size of objects gets promoted to older generation from younger which would end up triggering full GC.
9) Through experiments try to understand ratio of object promotions from younger to older generation and define the survivor ratio size and max age or tenuring for objects accordingly. I prefer to use max tenuring size to 1 or 2. Early promotions of objects to older generation from younger gen may also create fragmentations in older generations and would require compaction where CMS will not do in regular concurrent cycles and this will be done only in FULL GC provided if we enable the compaction on older gen.

10) Ensure initial mark phase (stop the world pause) is lesser than 2 seconds and this will impact the throughput of the app. So CMSDuration should be set appropriately.

11) If you are planning to use less than 2/3GB, better to use Parallel collector otherwise move to CMS.

We were using Oracle SOA suite and after lots of experimentation the following setting for admin and soa server helped me to acheive the best results. We had a single CPU with 8 Core (with 32 virtual CPU's). Earlier we used parallel collector, though the throughput was good but suffered with longer GC pauses affecting the cluster heartbeats as the older generation FULL GC cycle was taking avg time of about 30+ seconds with heap size to 2.3G to crawl. The JVM also used to generate the heap dump due to the lesser younger gen space so corrected by increasing size as per our requirement.

After moving to CMS, this pause time was reduced to <1+ second and also throughput improved after increasing the older generation size. Choosing the correct occupancy percentage will help to reduce the GC collections as well and thereby improves the throughput of the app.

Admin Server:
DEFAULT_MEM_ARGS="-Xss512k -XX:PermSize=640m -XX:MaxPermSize=640m -Xms3072M -Xmx3072M -XX:NewSize=1280m -XX:MaxNewSize=1280m -XX:SurvivorRatio=12 -XX:-UsePSAdaptiveSurvivorSizePolicy -XX:MaxTenuringThreshold=1 -XX:+UseConcMarkSweepGC -XX:+UseCompressedOops -XX:+UseParNewGC -XX:+CMSParallelRemarkEnabled -XX:ParallelGCThreads=10 -XX:+UseCMSInitiatingOccupancyOnly -XX:CMSInitiatingOccupancyFraction=80 -XX:+CMSScavengeBeforeRemark -XX:+UseTLAB -XX:+CMSClassUnloadingEnabled -XX:InitialCodeCacheSize=64m -XX:ReservedCodeCacheSize=64m -XX:+UseCMSCompactAtFullCollection -XX:CMSFullGCsBeforeCompaction=0 -XX:CMSWaitDuration=10000 -XX:+HeapDumpOnOutOfMemoryError -XX:HeapDumpPath=/reuters/export/home/eaiapp/crash/admin1_java.hprof"

SOA Server:-Xss512k -XX:PermSize=768m -XX:MaxPermSize=768m -Xms6g -Xmx6g -XX:NewSize=2048m -XX:MaxNewSize=2048m -XX:SurvivorRatio=12 -XX:-UsePSAdaptiveSurvivorSizePolicy -XX:MaxTenuringThreshold=1 -XX:+UseConcMarkSweepGC -XX:+UseCompressedOops -XX:+UseParNewGC -XX:+CMSParallelRemarkEnabled -XX:ParallelGCThreads=10 -XX:+UseCMSInitiatingOccupancyOnly -XX:CMSInitiatingOccupancyFraction=70 -XX:+CMSScavengeBeforeRemark -XX:+UseTLAB -XX:+CMSClassUnloadingEnabled -XX:InitialCodeCacheSize=64m -XX:ReservedCodeCacheSize=64m -XX:+UseCMSCompactAtFullCollection -XX:CMSFullGCsBeforeCompaction=0 -XX:CMSWaitDuration=30000 -XX:+HeapDumpOnOutOfMemoryError -XX:HeapDumpPath=/reuters/export/home/eaiapp/crash/soarcore_java.hprof

During server startup the CMS younger collector ParNEW, seems to be taking more time which looks to be dependent on CPU architecture as the CMS young collector or PAR new collector are slower compared to parallel collector. However, the same spikes were not observed in regular transactions.


SOA Server:


Admin Server:


Understanding GC pauses in JVM:


Concurrent Mark Sweep (CMS) is one of HotSpot JVM low pause garbage collectors. CMS can do most of its work for reclaiming memory concurrently with application (without stopping it). But still it requires few stop-the-world pauses to make its work. This article will explain nature of these pauses and how to minimize them.

Basics of concurrent mark sweep
HotSpot’s CMS is a generational collector, it means that heap is separated into young and old (tenured) space and these spaces are collected independently. For young space collection usual HotSpot’s copy collector is use. Concurrent Mark Sweep is used only to collect old space. To enable of using CMS collector you have to specify XX:+UseConcMarkSweepGC in JVM’s command line.
CMS collection cycle has following phases:
  • Initial mark – this is stop-the-world phase while CMS is collecting root references.
  •  Concurrent mark – this phase is done concurrently with application, garbage collector traverses though object graph in old space marking live objects.
  • Concurrent pre clean – this is another concurrent phase, basically it is another mark phase which will try to account references changed during previous mark phase. Main reason for this phase is reduce time of stop-the-world remark phase.
  • Remark – once concurrent mark is finished, garbage collector need one more stop-the-world pause to account references which have been changed during concurrent mark phase.
  • Concurrent sweep – garbage collector will scan through whole old space and reclaim space occupied by unreachable objects.
  • Concurrent reset – after CMS cycle is finished, some structures have to be reset before next cycle can start.
Unlike most other garbage collectors, CMS does not do compaction of heap space. Instead of moving objects to make unoccupied space continuous, CMS keeps lists of all fragments of free memory. This way CMS is avoiding cost associated with relocating of live objects (and relocating of objects is expensive operation which require stop-the-world pause), but as down size of this heap space is prone to fragmentation. To minimize risk of fragmentation CMS is doing statistical analysis of object’s sizes and have separate free lists for objects of different sizes.

Length of CMS pauses
CMS itself has only two pauses, but your application will also experience pauses of young space collector which is working in conjunction with CMS. See previous article about pauses of young space collector.

Initial mark
During   initial mark CMS should collect all root references to start marking of old space. This includes:
  • References from thread stacks,
  • References from young space.
References from stacks are usually collected very quickly (less than 1ms), but time to collect references from young space depends on size of objects in young space. Normally initial mark starts right after young space collection, so Eden space is empty and only live objects are in one of survivor space. Survivor space is usually small and initial mark after young space collection often takes less than millisecond. But if initial mark is started when Eden is full it may take quite long (usually longer than young space collection itself).
Once CMS collection is triggered, JVM may wait some time for young collection to happen before it will start initial marking. JVM configuration option –XX:CMSWaitDuration= can be used to set how long CMS will wait for young space collection before start of initial marking. If you want to avoid long initial marking pauses, you should configure this time to be longer than typical period of young collections in your application.

Remark
Most of marking is done in parallel with application, but it may not be accurate because application may modify object graph during marking. When concurrent marking is finished; garbage collector should stop application and repeat marking to be sure that all reachable objects marked as alive. But collector doesn’t have to traverse through whole object graph; it should traverse only reference modified since start of marking (actually since start pre clean phase). Card table (see card marking write barrier) is used to identify modified portions of memory in old space, but thread stacks and young space should be scanned once again.
 Usually most time of remark phase is spent of scanning young space. This time will be much shorter if we collect garbage in young space before starting of remark. We can instruct JVM to always force young space collection before CMS remark. Use JVM parameter –XX:+CMSScavengeBeforeRemark to enable this option.
Even is young space is empty, remark phase still have to scan through modified references in old space, this usually takes time close to normal young collection pause (due scanning of old space done during young collection is similar to scanning required for remark). 

When CMS collection starts?
Unlike stop-the-world old space collectors, CMS collection cycle should start before old space become full. CMS collection is triggered when amount of free memory in old space falls below certain threshold (this threshold can be chosen by JVM based of runtime statistics or set via parameters) and actual start of CMS collection cycle may be delayed until next young collection.
Normally objects are allocated in old space only during young space collection (which may promote some objects to old space). So CMS cycle usually starts right after young space collection, which is good because init mark pause will be very small.
But in certain cases object may be allocated directly in old space and CMS cycle could start while Eden has lots of objects. In this case initial mark can be 10-100 times slower which is bad. Usually this is happening due to allocation of very large objects (few megabyte arrays).  To avoid these long pauses you should configure reasonable –XX:CMSWaitDuration.

Configuring fixed threshold for CMS start
You can set fixed threshold for olds space occupation for triggering CMS cycle by using JVM options‑XX:+UseCMSInitiatingOccupancyOnly ‑XX:CMSInitiatingOccupancyFraction=70 (this will force CMS cycle to start when more than 70% of old space is used).

Explicitly invoking CMS cycle
You can also configure JVM to start CMS cycle by invocation of System.gc() by‑XX:+ExplicitGCInvokesConcurrent command line option.

Full GC with CMS
If CMS cannot free enough in old space, JVM may fallback to compacting collector. Compacting collector will force stop-the-world pause so it can be considered emergency case. Normally you would like to avoid full GC and long stop-the-world pause associated with it. Full GC may happen either if CMS is not fast enough for dealing with garbage (or collection cycle has been started too late) or due to fragmentation of old space (there is no large enough continuous space for object to be allocated). Also it is possible that you just didn’t give JVM enough memory and after full GC it will through OutOfMemoryExpection anyway.

Permanent generation collection
One of reasons why CMS may end up in full GC is garbage in permanent space. By default CMS does not reclaim unused space in permanent space. If your application is using multiple class loaders and/or reflection you may need to enable collecting of garbage in permanent space. JVM option ‑XX:+CMSClassUnloadingEnabled will allow CMS collector to clean permanent space. Remember that objects in permanent space may have references to normal old space thus even if permanent space is not full itself, references from perm to old space may keep some dead objects unreachable for CMS if class unloading is not enabled.

Utilizing multiple cores
CMS has multiple phases. Some of them are concurrent; others are stop-the-world pauses but may be executed in parallel to compressed application freeze time.

‑XX:+CMSConcurrentMTEnabled – allows CMS to use multiple cores for concurrent phase.
‑XX:+ConcGCThreads= – specifies number of thread for concurrent phases.
‑XX:+ParallelGCThreads= – specifies number of thread for parallel work during stop-the-world pauses (by default it equals to number of physical cores).
‑XX:+UseParNewGC – instructs JVM to use parallel collector for young space collections in conjunction with CMS.

Tuning Garbage Collection with Sun JDK

When using Sun's JDK, the goal in tuning garbage collection performance is to reduce the time required to perform a full garbage collection cycle. You should not attempt to tune the JVM to minimize the frequency of full garbage collections, because this generally results in an eventual forced garbage collection cycle that may take up to several full seconds to complete.
The simplest and most reliable way to achieve short garbage collection times over the lifetime of a production server is to use a fixed heap size with the default collector and the parallel young generation collector, restricting the new generation size to at most one third of the overall heap.
The following example JVM settings are recommended for most engine tier servers:

-server -XX:MaxPermSize=128m -XX:+UseParNewGC -XX:MaxNewSize=256m -XX:NewSize=256m -Xms768m -Xmx768m -XX:SurvivorRatio=128 -XX:MaxTenuringThreshold=0  -XX:+UseTLAB -XX:+UseConcMarkSweepGC -XX:+CMSClassUnloadingEnabled -XX:+CMSPermGenSweepingEnabled
If the engine tier server enables caching for call state data, the example settings are:

-server -XX:MaxPermSize=128m -XX:+UseParNewGC -XX:MaxNewSize=32m -XX:NewSize=32m -Xms768m -Xmx768m -XX:SurvivorRatio=128 -XX:MaxTenuringThreshold=0  -XX:+UseTLAB -XX:+UseConcMarkSweepGC -XX:+CMSClassUnloadingEnabled -XX:+CMSPermGenSweepingEnabled
For replica servers, use the example settings:

-server -XX:MaxPermSize=128m -XX:+UseParNewGC -XX:+UseConcMarkSweepGC -XX:MaxNewSize=64m -XX:NewSize=64m -Xms1536m -Xmx1536m -XX:SurvivorRatio=128 -XX:MaxTenuringThreshold=0 -XX:CMSInitiatingOccupancyFraction=60 -Dsun.rmi.dgc.server.gcInterval=0x7FFFFFFFFFFFFFFE -Dsun.rmi.dgc.client.gcInterval=0x7FFFFFFFFFFFFFFE
The above options have the following effect:
  • -XX:+UseTLAB—Uses thread-local object allocation blocks. This improves concurrency by reducing contention on the shared heap lock.
  • -XX:+UseParNewGC—Uses a parallel version of the young generation copying collector alongside the default collector. This minimizes pauses by using all available CPUs in parallel. The collector is compatible with both the default collector and the Concurrent Mark and Sweep (CMS) collector.
  • -Xms, -Xmx—Places boundaries on the heap size to increase the predictability of garbage collection. The heap size is limited in replica servers so that even Full GCs do not trigger SIP retransmissions. -Xms sets the starting size to prevent pauses caused by heap expansion.
  • -XX:NewSize—Defines the minimum young generation size. BEA recommends testing your production applications starting with a young generation size of 1/3 the total heap size. Using a larger young generation size causes fewer minor collections to occur but may compromise response time goals by cause longer-running full collections.
  • You can fine-tune the frequency of minor collections by gradually reducing the size of the heap allocated to the young generation to a point below which the observed response time becomes unacceptable.
  • -XX:MaxTenuringThreshold=0—Makes the full NewSize available to every NewGC cycle, and reduces the pause time by not evaluating tenured objects. Technically, this setting promotes all live objects to the older generation, rather than copying them.
  • -XX:SurvivorRatio=128—Specifies a high survivor ratio, which goes along with the zero tenuring threshold to ensure that little space is reserved for absent survivors.

Concurrent Mark Sweep Collector Enhancements


The concurrent mark sweep collector, also known as the concurrent collector or CMS, is targeted at applications that are sensitive to garbage collection pauses. It performs most garbage collection activity concurrently, i.e., while the application threads are running, to keep garbage collection-induced pauses short. The key performance enhancements made to the CMS collector in JDK 6 are outlined below. See the documents referenced below for more detailed information on these changes, the CMS collector, and garbage collection in HotSpot.
Note that these features only apply when the CMS collector is in use; the option -XX:+UseConcMarkSweepGC selects the CMS collector.
The System.gc() and Runtime.getRuntime().gc() methods instruct the JVM to run the garbage collector to recycle unused objects. The HotSpot implementation of these methods currently stops all application threads to collect the entire heap, which can result in a lengthy pause particularly when the heap is large. This works against the goal of the CMS collector to keep pauses short.
In JDK 6, the CMS collector can optionally perform these collections concurrently, to avoid a lengthy pause in response to a System.gc() or Runtime.getRuntime().gc() call. To enable this feature, add the option
-XX:+ExplicitGCInvokesConcurrent
to the java command line.
Several changes were made that increase the default size of the young generation when the CMS collector is used:
  • the minimum young generation size was increased from 4MB to 16MB.
  • the proportion of the overall heap used for the young generation was increased from 1/15 to 1/7.
  • the survivor spaces are now used by default, and their default size was increased. (In prior releases the survivor spaces were disabled by default with the CMS collector.)
The primary effect of these changes is to improve application performance by reducing garbage collection overhead. However, because the default young generation size is larger, applications may also see larger young generation pause times and a larger memory footprint. If necessary, please see the documents referenced below for more details on generations, survivor spaces and the options available for adjusting their sizes.
The CMS collector now uses multiple threads to perform the concurrent marking task in parallel on platforms with multiple processors. This reduces the duration of the concurrent marking cycle, allowing the collector to support applications with larger numbers of threads and higher object allocation rates, particularly on large multiprocessor machines. Prior releases used only a single thread for concurrent marking, limiting the collector's ability to keep up with applications with very high object allocation rates.

GCViewer

GCViewer Small Screenshot - Click to enlarge!
GCViewer is a free open source tool to visualize data produced by the Java VM options -
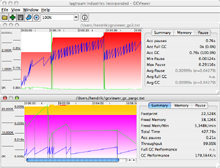
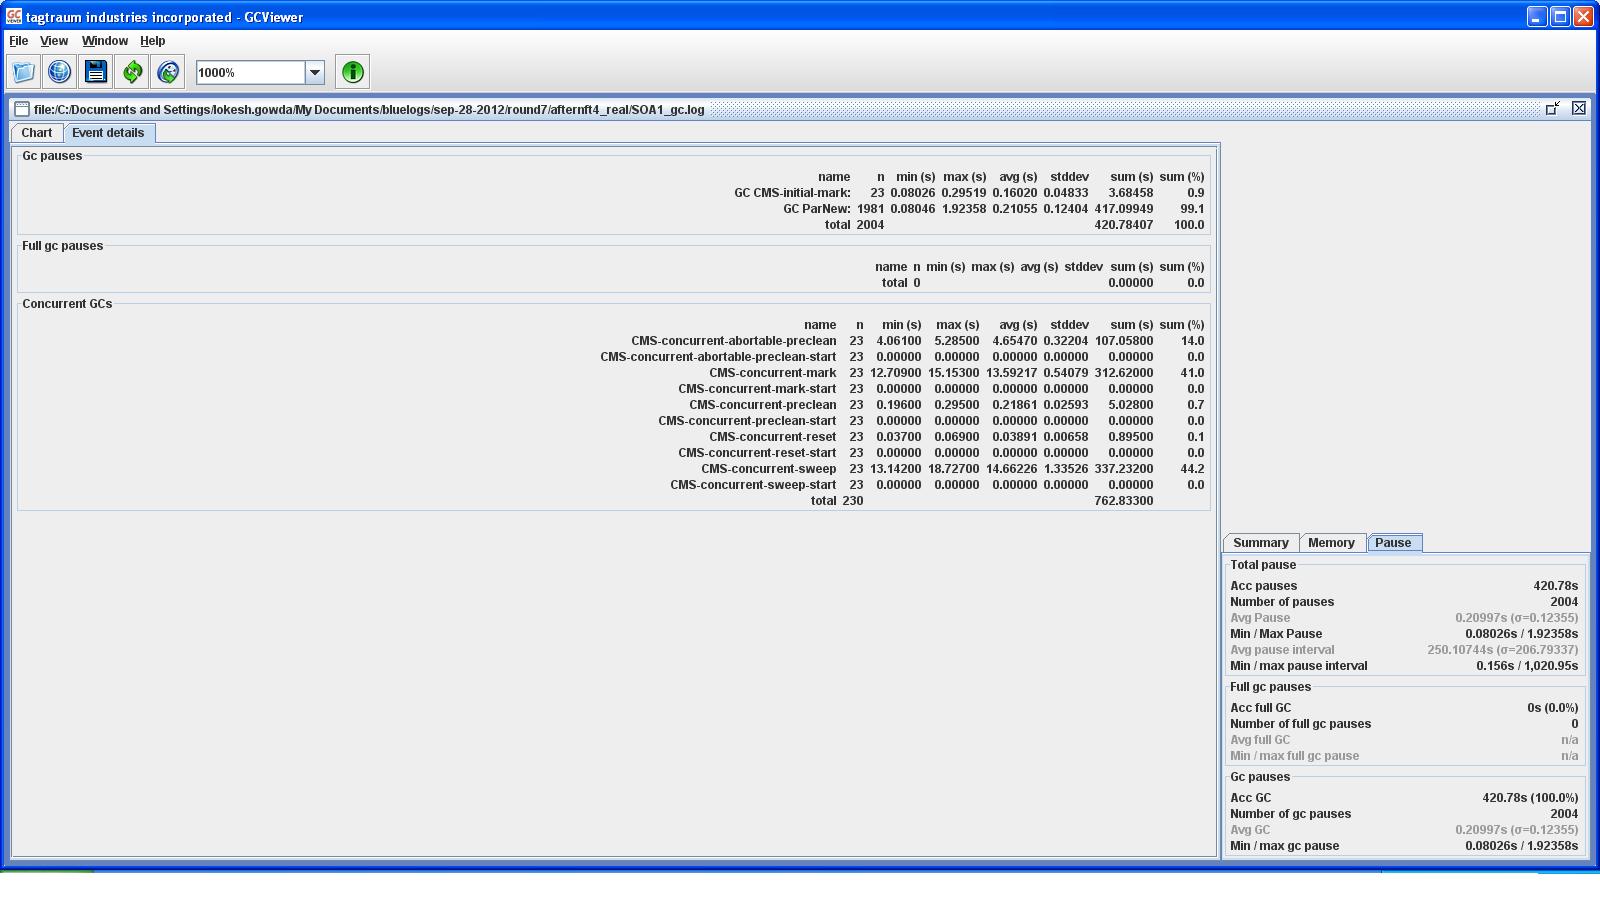
verbose:gc and-Xloggc:<file>. It also calculates garbage collection related performance metrics (throughput, accumulated pauses, longest pause, etc.). This can be very useful when tuning the garbage collection of a particular application by changing generation sizes or setting the initial heap size. See here for a useful summary of garbage collection related JVM parameters. For more information on tuning garbage collection on Sun JVMs, take a look at the documentation provided by Oracle.

Supported Formats

Best results are achieved with: -Xloggc:<file> -XX:+PrintGCDetails

Data Export

GCViewer can also export the data in CSV (comma separated values) format, which may easily be imported into spreadsheet applications for further processing.

Contribute/Newer Versions

I have stopped improving GCViewer in 2008, however, there is a current fork by Jörg Wüthrich athttps://github.com/chewiebug/GCViewer that aims at improving compatibility with current JVMs.

GCViewer 1.32
=============

GCViewer is a little tool that visualizes verbose GC output
generated by Sun / Oracle, IBM, HP and BEA Java Virtual Machines. It
is free software released under GNU LGPL.

You can start GCViewer (gui) by simply double-clicking on gcviewer-1.3x.jar
or running java -jar gcviewer-1.3x.jar (it needs a java 1.6 vm to run).

For a cmdline based report summary just type:
java -jar gcviewer-1.3x.jar gc.log summary.csv
to generate a report. 


Supported verbose:gc formats are:

- Sun / Oracle JDK 1.7 with option -Xloggc:<file> [-XX:+PrintGCDetails] [-XX:+PrintGCDateStamps]
- Sun / Oracle JDK 1.6 with option -Xloggc:<file> [-XX:+PrintGCDetails] [-XX:+PrintGCDateStamps]
- Sun JDK 1.4/1.5 with the option -Xloggc:<file> [-XX:+PrintGCDetails]
- Sun JDK 1.2.2/1.3.1/1.4 with the option -verbose:gc
- IBM JDK 1.3.1/1.3.0/1.2.2 with the option -verbose:gc
- IBM iSeries Classic JVM 1.4.2 with option -verbose:gc
- HP-UX JDK 1.2/1.3/1.4.x with the option -Xverbosegc
- BEA JRockit 1.4.2/1.5 with the option -verbose:memory

Best results are achieved with: -Xloggc:<file> -XX:+PrintGCDetails -XX:+PrintGCDateStamps

Hendrik Schreiber wrote GCViewer up to 1.29. What you are seeing here is based 
on his very good work.
Links to detailed descriptions of many JVM parameters relevant to garbage collection
can be found in the links section of https://github.com/chewiebug/GCViewer/wiki


GCViewer shows a number of lines etc. in a chart (first tab). These are:

- Full GC Lines:
     o Black vertical line at every Full GC
- Inc GC Lines:
     o Cyan vertical line at every Incremental GC
- GC Times Line:
     o Green line that shows the length of all GCs
- GC Times Rectangles:
     o Dark grey rectangle at every Full GC
     o Light grey rectangle at every Incremental GC
     o Grey rectangle at every 'normal' GC
- Total Heap:
     o Red line that shows heap size
- Tenured Generation:
     o Magenta area that shows the size of the tenured
       generation (not available without PrintGCDetails)
- Young Generation:
     o Orange area that shows the size of the young
       generation (not available without PrintGCDetails)
- Used Heap:
     o Blue line that shows used heap size
- Initial mark level:
     o Yellow line that shows the heap usage at "initial-mark" event
       (only available when the gc algorithm uses concurrent collections,
       which is the case for CMS and G1)
- Concurrent collections
     o Cyan vertical line for every begin (concurrent-mark-start) and
       pink vertical line for every end (CMS-concurrent-reset /
       G1: concurrent-cleanup-end) of a concurrent collection cycle

In the second tab ("Event details") it shows details about the events it parsed:
E.g. events like the following

24.187: [GC 24.188: [ParNew: 93184K->5464K(104832K), 0.0442895 secs] \
93184K->5464K(1036928K), 0.0447149 secs] \
[Times: user=0.39 sys=0.07, real=0.05 secs]

are shown in one line as
GC ParNew: <number of events parsed>, <min duration>, <max duration>...

Events like these

4183.962: [Full GC 4183.962: [CMS: 32957K->40326K(932096K), 2.3313389 secs] \
76067K->40326K(1036928K), [CMS Perm : 43837K->43453K(43880K)], 2.3339606 secs] \
[Times: user=2.33 sys=0.01, real=2.33 secs] 
 
are shown as
Full GC CMS: CMS Perm : <number of events parsed> ...

So for every line the text is extracted (not always every part of it). This allows
a user which is familiar with the text log files to find out more details about
the events that occurred.

Metrics
=======

GCViewer provides some metrics to help you interpret the graph.
Note that some metrics based on averages are shown along with
their standard deviation. If it is obvious that the standard
deviation is fairly big in comparison to the average, the values
are grayed out, indicating that actual values are much smaller
or bigger than the average.

Summary
-------

- Footprint:
     o Maximal amount of memory allocated
- Freed Memory:
     o Total amount of memory that has been freed
- Freed Mem/Min:
     o Amount of memory that has been freed per minute
- Total Time:
     o Time data was collected for (only Sun 1.5/1.4/1.2.2 and
       IBM 1.3.1/1.3.0/1.2.2)
- Acc Pauses:
     o Sum of all pauses due to GC
- Throughput:
     o Time percentage the application was NOT busy with GC
- Full GC Performance:
     o Performance of full collections. Note that all collections
       that include a collection of the tenured generation or
       are marked with "Full GC" are considered Full GC.
- GC Performance:
     o Performance of minor collections. These are collections
       that are not full according to the definition above.

Memory
------

- Total heap (usage / alloc max):
     o Max memory usage / allocation in total heap (the last is the 
       same as "footprint" in Summary)
- Tenured heap (usage / alloc max):
     o Max memory usage / allocation in tenured space
- Young heap (usage / alloc max):
     o Max memory usage / allocation in young space
- Perm heap (usage / alloc max):
     o Max memory usage / allocation in perm space
- Avg after full GC:
     o The average heap memory consumption after a full collection
- Avg after GC:
     o The average heap memory consumption after a minor collection
- Freed Memory:
     o Total amount of memory that has been freed
- Freed by full GC:
     o Amount of memory that has been freed by full collections
- Freed by GC:
     o Amount of memory that has been freed by minor collections
- Avg freed full GC:
     o Average amount of memory that has been freed by full
       collections
- Avg freed GC:
     o Average amount of memory that has been freed by minor
       collections
- Avg rel inc after FGC:
     o Average relative increase in memory consumption between full
       collections. This is the average difference between the
       memory consumption after a full collection to the memory
       consumption after the next full collection.
- Avg rel inc after GC:
     o Average relative increase in memory consumption between minor
       collections. This is the average difference between the
       memory consumption after a minor collection to the memory
       consumption after the next minor collection. This can be used
       as an indicator for the amount of memory that survives
       minor collections and has to be moved to the survivor spaces
       or the tenured generation. This value added to "Avg freed GC"
       gives you an idea about the size of the young generation in case
       you don't have PrintGCDetails turned on.
- Slope full GC:
     o Slope of the regression line for the memory consumption after
       full collections. This can be used as an indicator for the
       increase in indispensable memory consumption (base footprint)
       of an application over time.
- Slope GC:
     o Average of the slope of the regression lines for the memory
       consumption after minor collections in between full collections.
       That is, if you have two full collections and many minor
       collections in between, GCViewer will calculate the slope for
       the minor collections up to the first full collection, then the
       slope of the minor collections between the first and the second
       full collection. Then it will compute a weighted average (each
       slope wil be weighted with the number of measuring points it was
       computed with).
- initiatingOccFraction (avg / max)
     o CMS GC kicks in before tenured generation is filled.
       InitiatingOccupancyFraction tells you the avg / max usage in % of the
       tenured generation, when CMS GC started (initial mark).
       This value can be set manually using 
       -XX:CMSInitiatingOccupancyFraction=<value>. 
- avg promotion
     o Promotion means the size of objects that are promoted from young
       to tenured generation during a young generation collection.
       Avg promotion shows the average amount of memory that is promoted
       from young to tenured with each young collection (only available
       with PrintGCDetails)
- total promotion
     o Total promotion shows the total amount of memory that is promoted
       from young to tenured with all young collections in a file (only 
       available with PrintGCDetails)


Pause
-----

- Acc Pauses:
     o Sum of all pauses due to any kind of GC
- Number of Pauses:
     o Count of all pauses due to any kind of GC
- Avg Pause:
     o Average length of a GC pause of any kind
- Min / max Pause:
     o Shortest /longest pause of any kind
- Avg pause interval:
     o avg interval between two pauses of any kind
- Min / max pause interval:
     o Min / max interval between two pauses of any kind

- Acc full GC:
     o Sum of all pauses due to full collections
- Number of full GC pauses:
     o Count of all pauses due to full collections
- Acc GC:
     o Sum of all full GC pauses
- Avg full GC:
     o Average length of a full GC pause
- Min / max full GC pause:
     o Shortest / longest full GC pause
     
- Acc GC:
     o Sum of all pauses due to minor collections
- Number of GC pauses:
     o Count of all pauses due to minor collections
- Avg GC:
     o Average length of a minor collection pause
- Min / max GC pause:
     o Shortest / longest minor GC pause


Notes
=====

This is not a perfect tool. However, GCViewer can help you
getting a grip on finding out what's going on in your application
with regards to garbage collection.


JVM Monitoring tools:

Jmap

jmap
gcore 5831 gcore: core.5831 dumped 

jmap -dump:file=app.bin `which java` core.5831
jhat

jstat

Jstat prints data from a running JVM
jstat -gc -t -h10 <vmid> 10s 0 : to sample the status of the java heap of the <vmid> every 10 seconds.
C:\bea\jdk160_05\bin>jstat -gc -t -h10 812 1000
Timestamp S0C S1C S0U S1U EC EU OC OU PC PU YGC YGCT FGC FGCT GCT
4980.8 1984.0 1984.0 28.5 0.0 16256.0 3919.7 241984.0 15824.1 52224.0 52196.5 20 0.759 24 14.492 15.250
4981.8 1984.0 1984.0 28.5 0.0 16256.0 3925.3 241984.0 15824.1 52224.0 52196.5 20 0.759 24 14.492 15.250
4982.8 1984.0 1984.0 28.5 0.0 16256.0 4071.4 241984.0 15824.1 52224.0 52196.5 20 0.759 24 14.492 15.250
4985.9 1984.0 1984.0 28.5 0.0 16256.0 4084.7 241984.0 15824.1 52224.0 52196.5 20 0.759 24 14.492 15.250
4986.9 1984.0 1984.0 28.5 0.0 16256.0 4231.2 241984.0 15824.1 52224.0 52196.5 20 0.759 24 14.492 15.250
4987.8 1984.0 1984.0 28.5 0.0 16256.0 4231.2 241984.0 15824.1 52224.0 52196.5 20 0.759 24 14.492 15.250
HPROF is another Heap Profiler
What to look for in out of memory situations.
1. No swap or buffer space on the system. - System run out of RAM /Native code running has leak, bugs in JVM.
2. PermSpace getting getting occupied after some application enhancement of server migration. Seen soon after starting the server - Consider increasing perm space.
3. Gradual increase in permanent generation - Make sure  –Xnoclassgc is not used and also check for application memory leaks.
4. Unable to create new native thread - Increase in the process size. Application leak suspected.
5. Out of memory error- Java heap space. Check heap dumps , logs, verbose gc etc.,
6. Out of memory error - Perm space - consider increasing perm space.

HotSpot JVM garbage collection options cheat sheet

Article was updated, here you can find latest version.

In this article I have collected a list of options related to GC tuning in JVM. This is not a comprehensive list, I have only collected options which I use in practice (or at least understand why I may want to use them).

HotSpot GC collectors

HotSpot JVM may use one of 6 combinations of garbage collection algorithms listed below.
Young collector
Old collector
JVM option
Serial (DefNew)
Serial Mark-Sweep-Compact
-XX:+UseSerialGC
Parallel scavenge (PSYoungGen)
Serial Mark-Sweep-Compact (PSOldGen)
-XX:+UseParallelGC
Parallel scavenge (PSYoungGen)
Parallel Mark-Sweep-Compact (ParOldGen)
-XX:+UseParallelOldGC
Serial (DefNew)
Concurrent Mark Sweep
-XX:+UseConcMarkSweepGC
-XX:-UseParNewGC
Parallel (ParNew)
Concurrent Mark Sweep
-XX:+UseConcMarkSweepGC
-XX:+UseParNewGC
G1
-XX:+UseG1GC

GC logging options

JVM option
Description
General options
-verbose:gc or -XX:+PrintGC
Print basic GC info
-XX:+PrintGCDetails
Print more elaborated GC info
-XX:+PrintGCTimeStamps
Print timestamps for each GC event (seconds count from start of JVM)
-Xloggc:<file>
Redirects GC output to file instead of console
-XX:+PrintTenuringDistribution
Print detailed demography of young space after each collection
-XX:+PrintTLAB
Print TLAB allocation statistics
-XX:+PrintGCApplication\
StoppedTime
Print pause summary after each stop-the-world pause
-XX:+PrintGCApplication\
ConcurrentTime
Print time for each concurrent phase of GC
-XX:+HeapDumpAfterFullGC
Creates heap dump file after full GC
-XX:+HeapDumpBeforeFullGC
Creates heap dump file before full GC
-XX:+HeapDumpOnOutOfMemoryError
Creates heap dump in out-of-memory condition
-XX:HeapDumpPath=<path>
Specifies path to save heap dumps
CMS specific options
-XX:PrintCMSStatistics=<n>
Print additional CMS statistics if n >= 1
-XX:+PrintCMSInitiationStatistics
Print CMS initiation details
-XX:PrintFLSStatistics=2
Print additional info concerning free lists
-XX:PrintFLSCensus=2
Print additional info concerning free lists
-XX:+CMSDumpAtPromotionFailure
Dump useful information about the state of the CMS old generation upon a promotion failure.
-XX:+CMSPrintChunksInDump
In a CMS dump enabled by option above, include more detailed information about the free chunks.
-XX:+CMSPrintObjectsInDump
In a CMS dump enabled by option above, include more detailed information about the allocated objects.

JVM sizing options

JVM option
Description
-Xms<size> -Xmx<size> 
or
‑XX:InitialHeapSize=<size>
‑XX:MaxHeapSize=
<size>
Initial and max size of heap space (young space + tenured space). Permanent space does not count to this size.
-XX:NewSize=<size> 
-XX:MaxNewSize=<size>
Initial and max size of young space.
-XX:NewRatio=<ratio>
Alternative way to specify young space size. Sets ration of young vs tenured space (e.g. -XX:NewRatio=2 means that young space will be 2 time smaller than tenuted space).
-XX:SurvivorRatio=<ratio>
Sets size of single survivor space as a portion of Eden space size (e.g. -XX:NewSize=64m -XX:SurvivorRatio=6 means that each survivor space will be 8m and eden will be 48m).
-XX:PermSize=<size> 
-XX:MaxPermSize=<size>
Initial and max size of permanent space.
-Xss=<size> or
-XX:ThreadStackSize=<size>
Sets size of stack area dedicated to each thread. Thread stacks do not count to heap size.
-XX:MaxDirectMemorySize=<value>
Maximum size of off-heap memory available for JVM

Young collection tuning

JVM option
Description
-XX:InitialTenuringThreshold=<n>
Initial value for tenuring threshold (number of collections before object will be promoted to tenured space).
-XX:MaxTenuringThreshold=<n>
Max value for tenuring threshold.
-XX:PretenureSizeThreshold=<size>
Max object size allowed to be allocated in young space (large objects will be allocated directly in old space). Thread local allocation bypasses this check so if TLAB is large enough object exciding size threshold still may be allocated in young.
-XX:+AlwaysTenure
Promote all objects surviving young collection immediately to tenured space (equivalent of -XX:MaxTenuringThreshold=0)
-XX:+NeverTenure
Objects from young space will never get promoted to tenured space while survivor space is large enough to keep them.
Thread local allocation blocks
-XX:+UseTLAB
Use thread local allocation blocks in young space. Enabled by default.
-XX:+ResizeTLAB
Allow JVM to adaptively resize TLAB for threads.
-XX:TLABSize=<size>
Initial size of TLAB for thread
-XX:MinTLABSize=<size>
Minimal allowed size of TLAB

CMS tuning options

JVM option
Description
Controlling initial mark phase
-XX:+UseCMSInitiatingOccupancyOnly
Only use occupancy as a criterion for starting a CMS collection.
-XX:CMSInitiating\
OccupancyFraction=<n>
Percentage CMS generation occupancy to start a CMS collection cycle. A negative value means that CMSTriggerRatio is used.
-XX:CMSBootstrapOccupancy=<n>
Percentage CMS generation occupancy at which to initiate CMS collection for bootstrapping collection stats.
-XX:CMSTriggerRatio=<n>
Percentage of MinHeapFreeRatio in CMS generation that is allocated before a CMS collection cycle commences.
-XX:CMSTriggerPermRatio=<n>
Percentage of MinHeapFreeRatio in the CMS perm generation that is allocated before a CMS collection cycle commences, that also collects the perm generation.
-XX:CMSWaitDuration=<timeout>
Once CMS collection is triggered, it will wait for next young collection to perform initial mark right after. This parameter specifies how long CMS can wait for young collection.
Controlling remark phase
-XX:+CMSScavengeBeforeRemark
Force young collection before remark phase.
-XX:+CMSScheduleRemark\
EdenSizeThreshold
If Eden used is below this value, don't try to schedule remark
-XX:CMSScheduleRemark\
EdenPenetration=<n>
The Eden occupancy % at which to try and schedule remark pause
-XX:CMSScheduleRemark\
SamplingRatio=<n>
Start sampling Eden top at least before young generation occupancy reaches 1/n of the size at which we plan to schedule remark
Parallel execution
-XX:+UseParNewGC
Use parallel algorithm for young space collection.
-XX:+CMSConcurrentMTEnabled
Use multiple threads for concurrent phases.
-XX:ConcGCThreads=<n>
Number of parallel threads used for concurrent phase.
-XX:+ParallelGCThreads=<n>
Number of parallel threads used for stop-the-world phases.
CMS incremental mode
-XX:+CMSIncrementalMode
Enable incremental CMS mode. Incremental mode is meant for severs with small number of CPU.
Miscellaneous options
-XX:+CMSClassUnloadingEnabled
If not enabled, CMS will not clean permanent space. You should always enable it in multiple class loader environments such as JEE or OSGi.
-XX:+ExplicitGCInvokesConcurrent
Let System.gc() trigger concurrent collection instead of full GC.
‑XX:+ExplicitGCInvokesConcurrent\
AndUnloadsClasses
Same as above but also triggers permanent space collection.

Miscellaneous GC options

JVM option
Description
-XX:+DisableExplicitGC
JVM will ignore application calls to System.gc()